If you’re currently holding any zombies captive for research, try putting the temperature sensor up against a zombie’s skin and enter the ? command again. If you’re lacking in test subjects (or feeling less adventurous), just hold the sensor between your fingers. Either way, you should see the temperature part of the message change.
If the responses in the serial monitor indicate that the Arduino side of your control center is working properly, you can unplug the Arduino from the regular computer and attach it to a USB port of the Raspberry Pi.
If the numbers do not appear, then check that the sketch uploaded properly onto the Arduino. If the numbers reported are not what you would expect for one of the projects, then check the wiring for that particular project.
Look at the Arduino code in Project_13_Control_Center_USB, and you will see that unlike in All_Sensors, the setup function includes the following line at the end:
Serial.begin(9600);
This line tells the Arduino to open a serial connection, via its USB-serial interface, at a baud rate of 9600. The value passed to begin must match the value you set in the serial monitor’s baud rate drop-down list.
This sketch also has a change at the top of the loop function:
if (Serial.available() && Serial.read() == '?')
{
reportStatus();
}
These lines check whether any serial communication over USB is waiting to be processed. If so, when you send the ? message, the reportStatus function is called:
void reportStatus()
{
Serial.print(readVoltage());
Serial.print(" ");
Serial.print(readTemp());
Serial.print(" ");
Serial.print(digitalRead(doorPin));
Serial.print(" ");
Serial.print(digitalRead(pirPin));
Serial.print(" ");
Serial.println(digitalRead(smokePin));
}
The reportStatus function formats the response from earlier, separating the parts of the message with a space character. The final println command adds a newline character to the end of the response.
RASPBERRY PI SOFTWARE
The program for this project can be found in the Raspberry Pi/control_center_usb folder. To download all the Raspberry Pi programs used in this book in one go, you could also use the following commands from a terminal window on the Raspberry Pi:
$ cd /home/pi
$ git clone https://github.com/simonmonk/zombies.git
These commands should fetch all of the code for the book, including the Arduino code used in other projects.
NOTE
For these commands to work, you will need to have the Pi connected to your network with an Ethernet cable, and your Internet connection needs to be up and running. Therefore, this is definitely something to do when you sense the apocalypse looming. Don’t wait until afterward!
To start the control center, you need to run the Python program control.py. Enter the following commands in a terminal window on your Raspberry Pi:
$ cd "zombies/Raspberry Pi/control_center_usb"
$ python control.py
When the program has started up, the window in Figure 8-5 should appear.
The program displays the readings from the Arduino in a human-readable way, and any readings that require your immediate attention will be highlighted in red. When there is no cause for alarm, the readings will be green. In this example, my door is open, which means zombies may be breaking into my compound as I write! While I go check on that, you can open the control_center_ usb.py file in a text editor and take a look.
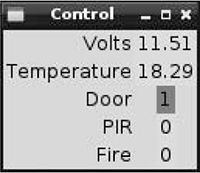
Figure 8-5: The control center
NOTE
This is the first time we have looked at Python code since Chapter 5, so the syntax may look unfamiliar after so much Arduino code. If you get confused about which is which, just keep in mind the main differences: in Python code, there aren’t any semicolons at the end of lines, and indentation is used to group code into blocks instead of curly braces as in Arduino code.
I haven’t listed the full code for the control center here as it is almost 100 lines, but in the following paragraphs, I’ll highlight a few key features. It is useful to know how the code works in case you decide you’d like to modify it. You might, for instance, want to improve the display window so it has an extra column for the units used in the measurements. You could even have it display more explicit warnings about fires, detected zombies, and so on to tell you when you need to get out of your base in a hurry. Visit http://effbot.org/tkinterbook/tkinter-index.htm to find out more about making fancy user interfaces in Tkinter.
THRESHOLD VALUES
At the top of the file are three constants that may need to be changed:
MIN_VOLTS = 11.0
TEMP_MIN = -10.0
TEMP_MAX = 45.0
These constants specify the value limits that determine when the results turn red in the control window. In this example, if the voltage drops under 11V, that row will turn from green to red. The same happens if the temperature drops below –10 or rises above 45 degrees Celsius. The units of temperature used in TEMP_MAX and TEMP_MIN come from the units you used in the Arduino sketch. For details on how to switch between degrees Celsius and Fahrenheit, refer to “Project 12: Temperature Alarm” on page 131.
Set your thresholds to appropriate values for your base, taking into account how much advance warning you want if your battery level gets low or the temperature rises.
STATUS LABELS
The following code shows how the labels and results in the user interface are coded, using battery voltage as an example. The code is contained within a class named App, and the user interface is defined in the __init__ initialize method of this App class.
Label(self.frame, text='Volts').grid(row=0, column=0, sticky=E)
self.volts_var = StringVar()
self.volts_label = Label(self.frame, textvariable=self.volts_var)
self.volts_label.grid(row=0, column=1)
The first line creates the label Volts and positions it using a grid layout at row 0, column 0. The sticky attribute indicates that the field should “stick” to the “east” wall of the layout cell—in other words, be right justified.
The second line defines a special type of variable (StringVar) used by the Tk graphics library that provides the user interface for the program. This variable is assigned to a member variable called volts_var, which is then referenced in the third line when the label for the voltage value is defined. When the value of the volts_var variable changes, the label field will automatically display the new value of volts_var.
Grid layouts divide the window up rather like table cells and allow you to specify the positions of user interface items without having to provide exact coordinates. The grid is arranged as rows numbered from top to bottom, with the topmost row being 0, and as columns numbered from left to right, with the leftmost column being 0. The last line of code for the volts display positions the label on the grid layout at row 0 and column 1 to put it alongside the label Volts.